Boxes
I recently listened to a ChatWithTraders episode with Christian Carreon. It was an emotional interview where trading was an avenue for Christian to provide financial stability for himself and his family. I probably listened to this episode five or six times as it gave me some ideas to revise and optimize my own strategies.
The episode can be accessed via this direct link. In this interview, Christian talks about how he uses a concept of trading boxes. I thought this concept was interesting and I've been incorporating it into my own strategies.
What is the box trading strategy?
I believe this originated from The Darvas Box, which is a trend following system. It's based on the observation that price moves in one of three possible ways at any given time. Price can either move up, move down, or sideways. Money is made when price moves either up or down as this indicates a trend. When price moves sideways, it's in a period of consolidation. By drawing a box around this consolidation, you can detect when the trend will resume.
Here is a version of what it looks like.
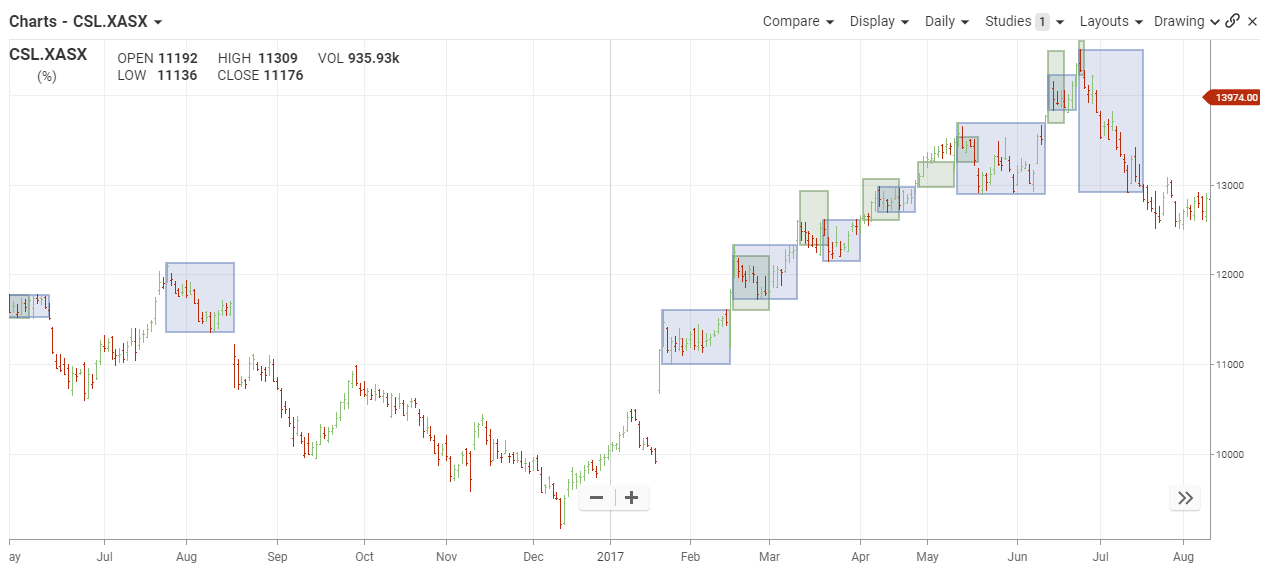 |
| Source: Sequoia Direct Pty Ltd |
If you're interested in learning more about the Darvas Box methodology, TradingSim provides a great introduction.
Limitations and considerations:
TradingSim says that the Darvas Box strategy works best in strong bull markets. This makes sense as this is a trend following strategy. Since both the futures and equities markets have a natural upside, this strategy could potentially work very well. Since FX is an oscillating market that's based on relative strength of currencies and world economies, there are some trend-following limitations.
For one, I find that this strategy does not work well with intraday charts. Price whipsaws more and does not consolidate as cleanly. Instead, I've found it very useful in higher timeframe analysis. Like Christian, I have adapted and modified this concept to fit it into my own trading style.
How I've traded:
Historically, I've only ever taken entries on structural breakouts like the one below.
 |
| USDJPY Daily |
In chronological order, here is how I analyze this USDJPY chart in real time:
- When price fails to make a higher high and starts ranging, I plot a neckline to watch for a downside breach. The idea here is to develop a directional bias of what is probabilistically more likely. Since price was in an uptrend, I am not looking to buy. Why would I be buying after everybody else?
- If price continues higher, I would sit out because demand will thin out. If price breaches my neckline, I would short and capitalize on being one of the early entrants in a reversal move (or downtrend).
By trading very structural breakouts and capitalizing on the initial momentum, I've been able to achieve some success with a win rate of 50%. The problem is that this strategy isn't optimized and it's due to a small account disadvantage.
Since I am trading with a small account, it is not possible to hold positions through pullbacks and whipsaws. It would cause greater fluctuations in my overall P&L. Instead, I capitalize on the initial selling momentum and get out with a profit once the it (the momentum) dies off. It's a safer play, but it does cause me to miss out on the rest of the downtrend until it bottoms out and begins reversing again.
Basically, after shorting this pair in November 2022, I am not trading this pair again or entering until the buy signal in February 2023.
Incorporating boxes:
Let's start off with a chart first this time.
 |
| USDJPY Daily |
By plotting trading "boxes" to identify periods of consolidation, this allows me to be more agile and opportunistic with my trading. If I only capitalize on the initial reversal and then sit out the entire trend, I'm not trading very efficiently.
After the neckline breach, I've established a downtrend formation. Every time price breaches the lower boundary of a "trading box," it's an indication that there's momentum. So why not capitalize on them?
I'm currently in the process of experimenting with trend trading a bit more in order to better answer the following questions:
- Has my win rate changed?
- Has my payoff structure changed?
- Have I improved my expectancy by incorporating box breakouts
I also need to figure out my exit strategy. For each of the additional short opportunities, the breakout momentum ended more quickly. How do I exit the subsequent trades without giving back any profits?
I can currently think of two ways, which I still have to test to see which is more effective:
- Set a take profit based on my daily ATR reading. If price moves to the extent of the daily ATR, then I exit. This is because the odds of price moving beyond the daily ATR range are very low.
- Simply monitor intraday price action and exit when price forms a consolidation.